ARCvURCplot
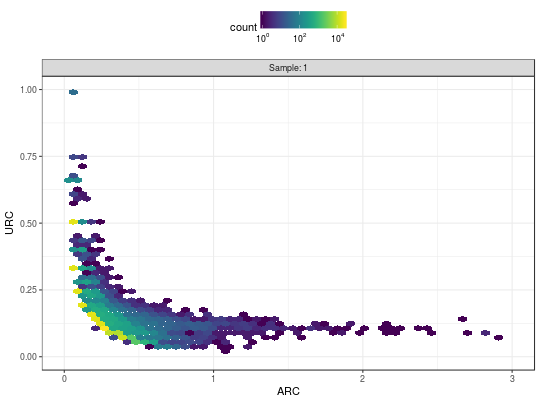
ARCvURCplot returns a ggplot object with the ARC vs
URC plot to analyze enrichment and library complexity in ChIP-exo data.
ARCvURCplot(..., names.input = NULL, both.strand = FALSE)
Arguments
- ...
- a
listofExoDataobjects, or severalExoDataobjects by themselves. - names.input
- a character vector with the names to use in the
plot. If it is empty
ARCvURCplotis going to create the names as the names of the list when they are available or is going to name them as Sample: 1 ,... , Sample: k. - both.strand
- A logical value indicating if the
DataFramecontains only regions with reads aligned to both strand or all. The default value isFALSE.
Value
A ggplot2 object with the ARC vs URC plot.
Examples
data(exoExample)
ARCvURCplot(exoExample)#> Warning: Removed 7 rows containing non-finite values (stat_binhex).#> Warning: Removed 2 rows containing missing values (geom_hex).