FSRDistplot
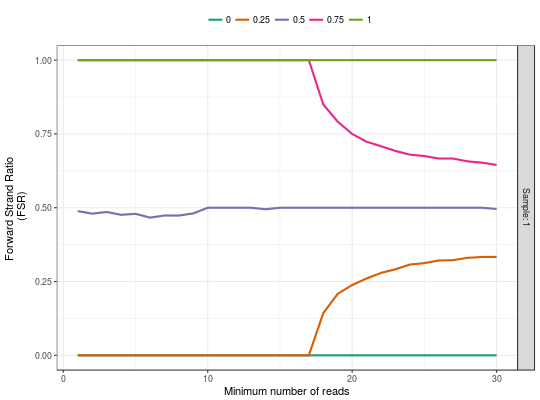
FSRDistplot returns a ggplot object with the Forward
Strand Ratio distribution plot to analyze strand imbalance in
ChIP-exo data.
FSRDistplot(..., names.input = NULL, quantiles = c(0, 0.25, 0.5, 0.75, 1),
  depth.values = seq_len(30), both.strand = FALSE)
Arguments
- ...
- a
listofExoDataobjects, or severalExoDataobjects by themselves. - names.input
- a character vector with the names to use in the
plot. If it is empty
FSRDistplotis going to create the names as the names of the list when they are available or is going to name them as Sample: 1 ,... , Sample: k. - quantiles
- a numeric vector with the quantiles used to estimate the
FSR distribution at a given depth. The default value is
c(0,.25,.5,.75,1)) - depth.values
- a numeric vector indicating the regions with depth
less or equal to, that are going to be filtered out. The defaulta values
are
seq_len(50). - both.strand
- a logical value indicating if the
DataFramecontains only regions with reads aligned to both strand or all. The default value isFALSE.
Value
A ggplot2 object with the FSR distribution plot.
Examples
data(exoExample)
FSRDistplot(exoExample)