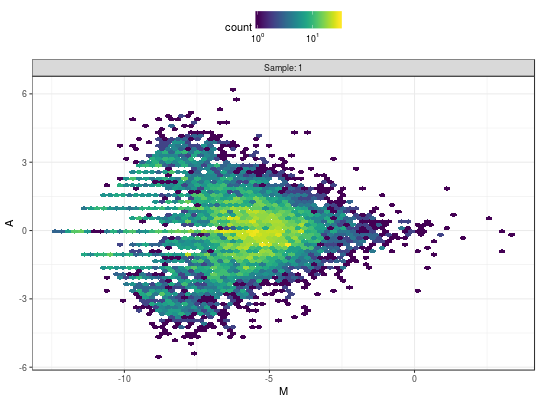
MAplot
MAplot returns a ggplot object with the MA plot to
analyze the strand imbalance in ChIP-exo data.
MAplot(..., names.input = NULL)
Arguments
- ...
- a
listofExoDataobjects, or severalExoDataobjects by themselves. - names.input
- a character vector with the names to use in the
plot. If it is empty
MAplotis going to create the names as the names of the list when they are available or is going to name them as Sample: 1 ,... , Sample: k.
Value
A ggplot2 object with the MA plot.
Examples
data(exoExample)
MAplot(exoExample)