regionCompplot
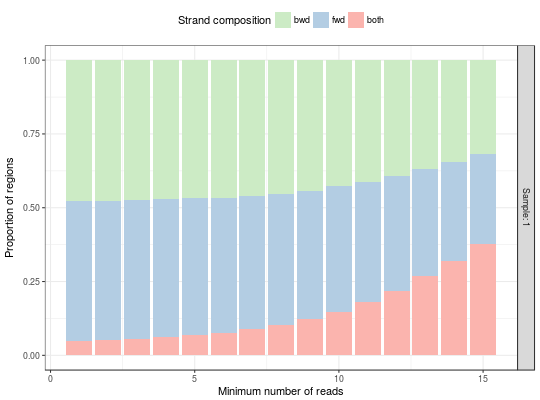
regionCompplot returns a ggplot object with the
Region Composition plot to analyze strand imbalance in ChIP-exo data.
regionCompplot(..., names.input = NULL, depth.values = seq_len(15))
Arguments
- ...
- a
listofExoDataobjects, or severalExoDataobjects by themselves. - names.input
- a character vector with the names to use in the
plot. If it is empty
regionCompplotis going to create the names as the names of the list when they are available or is going to name them as Sample: 1 ,... , Sample: k. - depth.values
- a numeric vector indicating the regions with depth
less or equal to, that are going to be filtered out. The defaulta values
are
seq_len(50).
Value
A ggplot2 object with the Region Composition plot.
Examples
data(exoExample)
regionCompplot(exoExample)